Difference between revisions of "Physics 434, 2012: Homework 7"
nemenman>Ilya |
m (1 revision imported) |
(No difference)
| |
Latest revision as of 11:28, 4 July 2018
Back to the main Teaching page.
Back to Physics 434, 2012: Information Processing in Biology.
GIven that we have less time for this homework, let's just do math, but not coding.
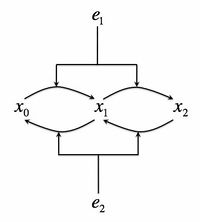
- Consider the following biochemical signaling circuit, which is supposed to represent the Mitogen-activated protein (MAP) kinase pathway, which is one of the most universal signaling pathways in eukaryotes. A protein can be phosphorylated by a kinase, present in a concentration . The kinase then must dissociate from the protein. It can then rebind it again and phosphorylate it on the second site. The total protein concentration is and unposphorylated, singly, and doubly poshporylated forms will be denoted as respectively, so that . At the same time, a phosphotase with concentration is dephosphorylating the protein on both sites. See the adjacent figure for the cartoon of this signaling system. However, for this problem we assume that production of both and just started, their concentrations are near zero, and so there is nothing yet to dephosphorylate.
- Write a set of differential equations that describes the rate of production of and .
- Sketch the rate of production of at this initial moment as a function of .
- We have discussed in class that functions can be represented by their Fourier transforms . Transformation from a function to its transform and back is as easy as taking one integral. For functions that are periodic, so that for any , the result is even simpler, and the functions can be represented often by their Fourier series , where , and are called the Fourier coefficients of . Let's explore how good such representations are. Let's study the partial sums of the Fourier series for , denoted by . Calculate (analytically) the Fourier coefficients for the following three functions defined for . (a) ; (b) ; (c). Plot some the first ten partial sums of the Fourier series for all of these functions to observe how the sums converge. Use one figure per function (that is, plot the sums on the same figure). Note that the Fourier coefficients decrease the slowest for the function that is discontinuous, (a), and the fastest for the function that is smooth, (c).
- A common signaling element in cells is the so called Incoherent Feedforward Loop: is a signal, which activates the response and the intermediate memory node . The intermediate node then suppressed the output: . Repeat the procedures we've done in class to calculate the frequency dependent gain for this system. Plot the curve for and . Explain the differences. Graduate students: Incorporate Langevin noise into the system and calculate the SNR for it.


![{\displaystyle x(t)={\frac {a_{0}}{2}}+\sum _{n=1}^{\infty }\,[a_{n}\cos(nt)+b_{n}\sin(nt)]}](https://wikimedia.org/api/rest_v1/media/math/render/svg/9dd77102db2c6ff7da6b4c517b724f09350e5c87)


![{\displaystyle S_{N}[x(t)]={\frac {a_{0}}{2}}+\sum _{n=1}^{N}\,[a_{n}\cos(nt)+b_{n}\sin(nt)],\quad N\geq 0.}](https://wikimedia.org/api/rest_v1/media/math/render/svg/78f108c9f2ef25a1503d66917c43694f5554b845)


